Operations concept · Last updated July 28, 2026
What is deferred production,and how do you cut it?
Deferred production is the production you had the reserves and the equipment to make, but did not, because the well waited on attention. It is not decline and it is not curtailment. It is barrels you were set up to sell, lost to a queue: the down well that waited on a truck, the underperformer nobody scored, the workover parked behind smaller jobs. On most fields it is the largest controllable production lever, and the least visible one.
The definition, precisely
Deferred production is a queue problem, not a reservoir problem.
Every producing well has a capability: what it should deliver today given its reservoir, its lift system, and its facility constraints. Deferred production is the gap between that capability and what actually flowed, accumulated across every well, every day. The causes are ordinary: a well down overnight that nobody visits until Thursday because Thursday is when the route comes through; a plunger-lift well cycling badly for two weeks; a tank sitting full with no haul scheduled; a workover queued behind three jobs worth a fraction of its value.
Two things make it different from decline. First, it is recoverable: the barrels come back when the right work happens sooner. Second, it is controllable with the crew you already have, because the fix is almost never more people. It is the same people, pointed at the highest-dollar problem first.
One terminology note, because it changes how the problem gets measured: the term is deferred production, not deferred downtime. Downtime is one cause among several. An operator who tracks only downtime is measuring the visible minority of the deferral bucket.
Why you cannot see it
Three places deferred production hides.
Almost no operator has a line item called deferred production. The dollars leak through three reporting gaps, and each gap makes the next one harder to see.
Aggregation
Monthly production accounting rolls every daily loss into one average. A well that lost three days waiting on a truck and a well that ran clean all month arrive on the same report as slightly different monthly totals. The deferral is real cash, but by the time it is visible it is a variance line, not a decision.
Downtime accounting
Downtime reports count wells that were flagged down. They do not count the well that ran at 60% of capability for two weeks because a choke drifted, a compressor starved it, or the plunger cycle went wrong. Underperformance that never trips a down flag is deferred production that never makes any report.
Alarm fatigue
The signal usually existed. It sat in a SCADA alarm list with two hundred other alarms, ranked by severity color instead of by dollars. When every alarm looks the same, the crew works the loudest one, and the most expensive deferral waits behind a nuisance separator alarm.
The dollars-per-day math
Price the queue and the priority argument ends.
Take one well. A 60 BOE per day well that goes down Friday night and waits for the Monday route defers roughly 150 barrels of oil equivalent. At an assumed $70 per barrel realization, that is about $10,500 of gross revenue pushed out of the quarter by a single weekend of queue position (illustrative worked example at a stated price assumption, not a measured figure). The well did nothing wrong. The schedule did.
Now scale it. On a 500-well field where 5% of capability is deferred at any given time, the deferral bucket runs in the thousands of dollars per day, every day, spread thin enough across wells and routes that no single loss ever forces a decision. That thin spread is exactly why deferred production survives: each individual deferral is too small to escalate, and the sum never appears on one screen.
Unless the software prices it. The morning brief below is what a priced deferral bucket looks like at the start of a shift: the day's exceptions scored in dollars, summed at the top, ranked underneath (product screenshot with synthetic demo data).
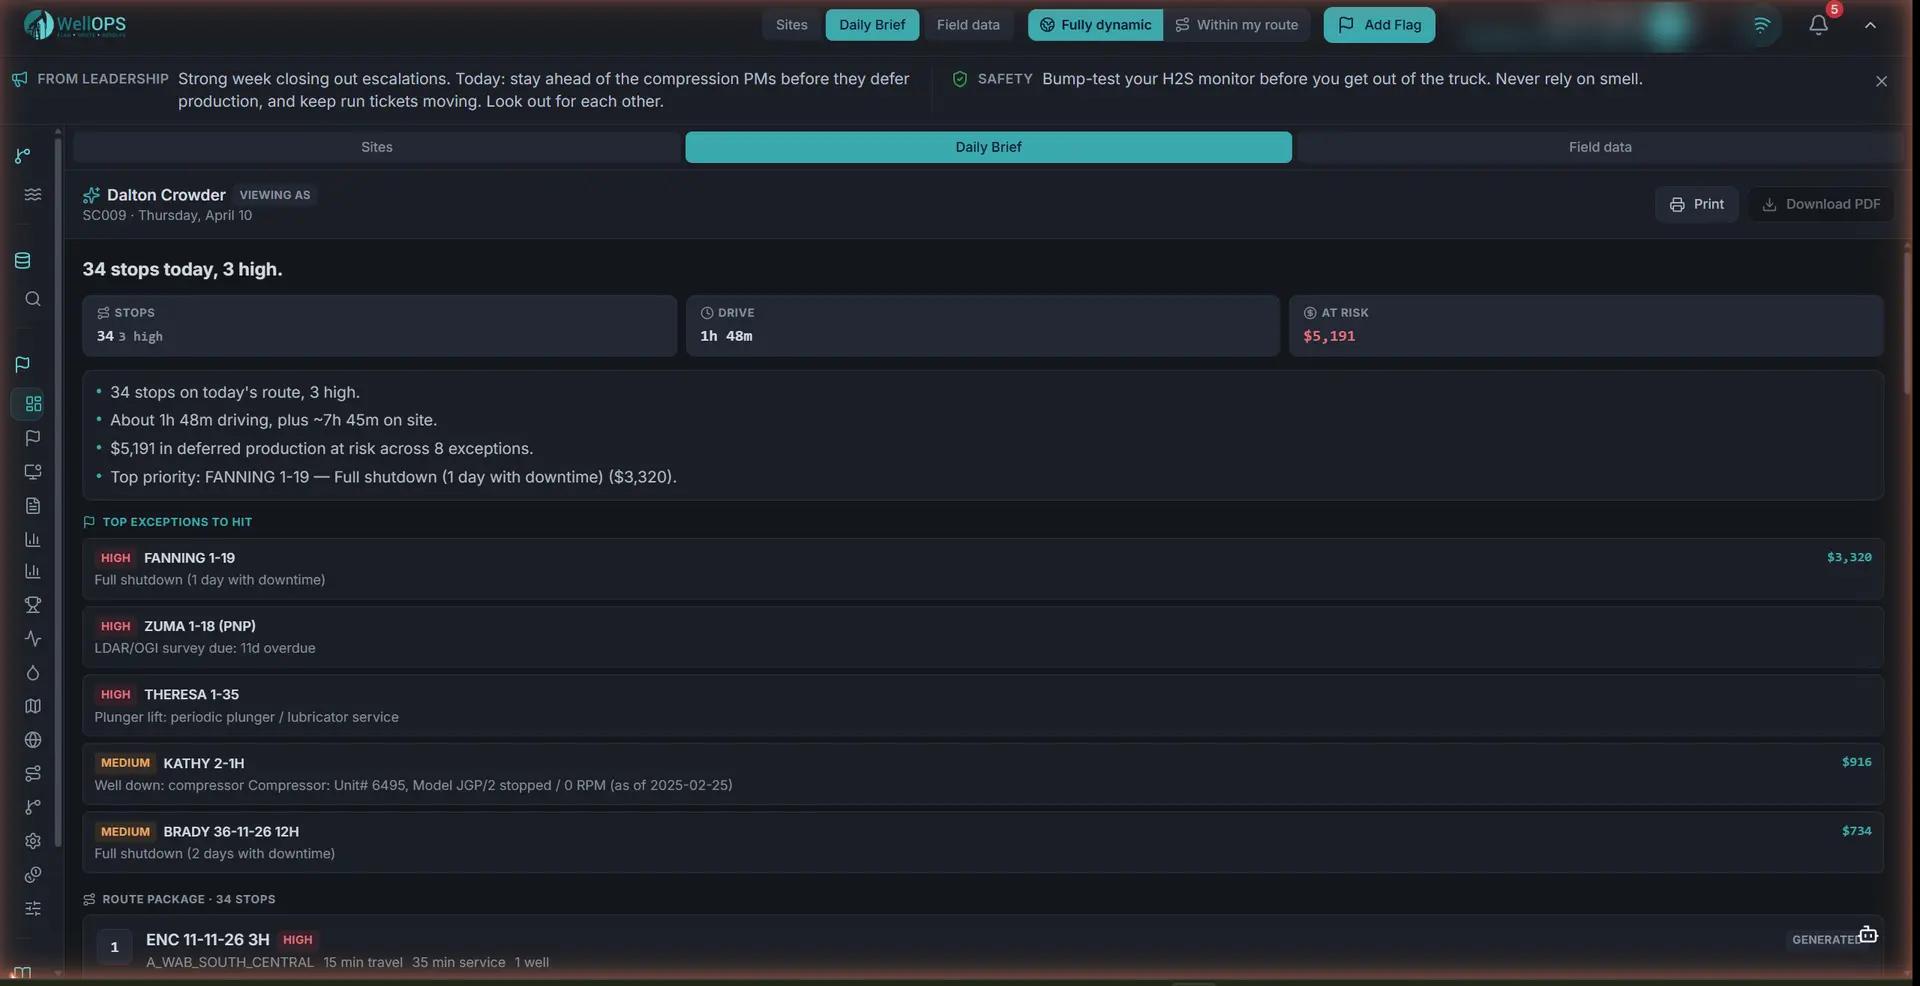
A priced morning: $5,191 at risk before 6 AM, ranked by dollars. Synthetic demo data.
What cutting it looks like
A 60% cut in deferred production. A 5 to 10% production uplift.
Cut in the deferral bucket itself: down-well hours, late responses, and unworked exceptions shrink because the highest-dollar deferral gets a truck first.
Deployment figure
The resulting total production uplift. Deferred production is a small share of total production, so recovering 60% of it lifts the whole field by roughly 5 to 10%.
Derived from the 60% cut, same deployment
State the relationship carefully: the 60% is the cut in the deferral bucket, and the 5 to 10% is the production uplift it produces. Quoting the 60% as a production uplift would overstate the result many times over, and the honest version is impressive enough. The full labeled proof set, including how each number is measured, is on the numbers page.
Want the math on your own footprint? The route economics calculator models annual dollars recovered from your well count, your deferral rate, and your route miles, modeled on deployment averages, with the result shown on-page.
Where WorkSync fits
Cutting deferral is a ranking problem. Ranking is what the engine does.
Deferred production shrinks when three things happen in order: every exception is caught early (the signal is scored the night it appears, not the week the accounting closes), every exception is priced (dollars at risk, not severity color), and the day is sequenced so the biggest dollars get worked first. Pump by priority is that loop, productized: WellOPS scores every well overnight on the data already in your SCADA, historian, and accounting systems, and puts a ranked, drivable plan in every truck cab by 6 AM. The most sophisticated prioritization engine in the field, pointed at the least visible line on your income statement.
The adoption path is deliberately short: read-only integration in about a week, the ranked plan in the truck within the 4-week stand-up, measured against your own pre-deployment baseline. Don't leave production on the table because the wrong work was done first.
Deferred production, common questions
What is deferred production in oil and gas?
Deferred production is production you had the reserves and the equipment to make but did not, because the well waited on attention: a down well waiting on a truck, an underperforming well nobody scored, a workover queued behind lower-value jobs. It is distinct from decline (the reservoir giving less) and from curtailment (choosing not to produce). Deferred barrels are usually recoverable if the right work happens sooner.
Is deferred production the same as downtime?
No, and the difference matters. Downtime is one cause of deferred production, and downtime accounting only captures wells that were flagged down. Deferred production also includes underperformance: wells producing below capability without ever tripping a down flag. That is why the correct term is deferred production, not deferred downtime, and why downtime reports understate the problem.
How is deferred production measured?
Against well capability: the production a well should deliver given its current reservoir, lift, and facility constraints. The gap between capability and actual, summed across the field and priced at realization, is the deferral bucket in dollars. Operators who measure it from their own downtime and variance records are usually surprised by the size, because aggregation had been hiding it.
How much can deferred production be cut?
In live WorkSync deployment, ranking every exception by dollars at risk and dispatching against that ranking cut deferred production by 60% (deployment figure, measured against the pre-deployment baseline on the same well set). Because deferred production is a small share of total production, that 60% cut showed up as roughly a 5 to 10% total production uplift. The 60% is the cut in the deferral bucket; the 5 to 10% is the uplift. The two are never interchangeable.
Do I need new sensors or a SCADA upgrade to reduce deferred production?
No. The deferral signal is almost always already in the data you have: SCADA trends, historian tags, production accounting variances, and work-order history. What is missing is a nightly score that turns those signals into a ranked, dollar-weighted work plan. WorkSync deploys read-only onto the existing stack; new sensors earn their place on individual well ROI math after the score is running.
What does WorkSync actually do about deferred production?
WellOPS scores every well and every exception overnight by cash flow at risk, then builds each crew a ranked plan that puts the highest-dollar deferral first, sequenced into a drivable route. The well that is quietly deferring $2,000 a day outranks the nuisance alarm, every morning, automatically. The measured results are published with their labels on the numbers page.
Are your best people working on your most valuable work today?
Price your own deferral bucket.
Four weeks from read-only integration to a ranked plan in the truck cab, measured against your own baseline.
Continue the cluster: Lease Operator Routes · Exception-Based Surveillance · WellOPS, the field operations product