The supermajors paid six to eight years and several hundred million dollars apiece to clear the bar. The Lower-48 winners closed the same gap in twenty-four months. The math on a 500-well operator at $70 oil is $7.66 million in annual cash flow that is either yours or someone else's at the next deal cycle. This is what the new operating floor looks like, who set it, and the four-week path for the operators still on the wrong side.
The Bar Has Moved
Three years. Fifteen percent. That is the new operating bar in upstream oil and gas. Efficiency through technology, on the asset base you already operate, measured against your own baseline.
If your operation has not cleared it, the gap is no longer a roadmap item. It is a redetermination problem, a borrowing-base problem, and at the next downcycle it is an acquisition problem. The reserves are unchanged. The land position is unchanged. The crew skill is unchanged. What changed is the operating model that the buyers, the lenders, and the supermajor neighbors now treat as the floor.
This is not a vendor framework. It is a description of an operating fact that has already been productionized at the operators with the most basin position to defend. The math is published. The case studies are peer-reviewed. The four-week adoption path is documented. The only question left for an independent operating in 2026 is whether to clear the bar this quarter or absorb the cost of being on the wrong side of it at the next deal.
The Math on $7.66 Million
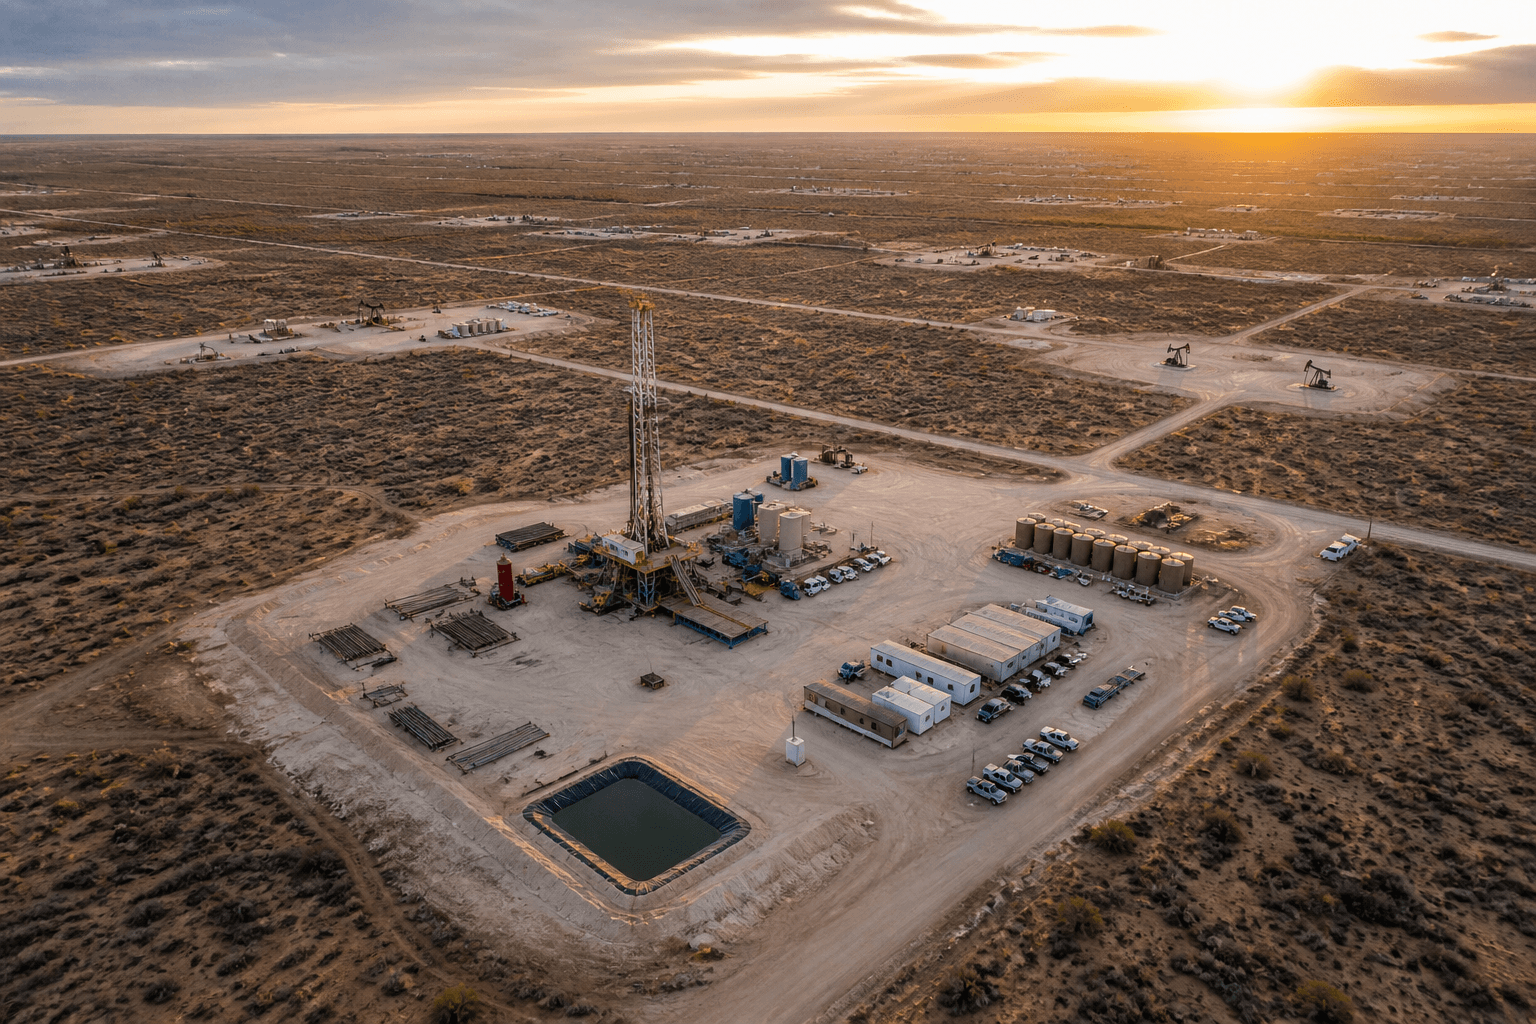
The simplest way to size the bar is one calculation on a representative 500-well operation.
Five hundred wells. An average of thirty barrels of oil per day per well. Three hundred and sixty-five operating days. A $70 realized price. That is $3.83 billion in annual gross revenue before any deferment, lifting cost, or capital draw. Apply a 2% deferment recovery, which sits below every Lower-48 production-AI deployment that has reported a number, and the answer is approximately $7.66 million in annual cash flow that the asset is currently leaving in the field.
The 15% bar is the aggregate of the same recovery applied to a portfolio of operating levers: deferred production, route inefficiency, reactive maintenance, hauling and inventory mismatch, and engineering allocation. The structural breakdown of where the 15% leaks is documented in The 15% Cash Flow You're Leaving in the Field. The 2% deferment recovery is the visible first lever. The other levers add to the same direction, and the math compounds.
The point of the calculation is not the exact number. The point is the order of magnitude. A 500-well operator running 5%+ behind the bar is leaving more than $2.5 million in annual cash flow on the table. A 500-well operator running 15% behind is leaving $7.66 million. The line between an FCF-positive year and an FCF-thin year, at $70 oil, is often inside that range.
At a top 25 private producer running over 5,000 wells across the Western Anadarko, Permian, and Wyoming, the same math at scale closed a 15%+ FCF gap inside six months on the existing asset base. No new wells drilled. No incremental headcount. The deployed reference is on the public-facing operating record. The math is durable.
Want case studies and benchmarks like these?
For upstream + midstream operations leaders. Share your work email and our team will follow up with case studies, benchmarks, and what's changing in the field.
The Supermajor Tuition Bill
The reason the bar is now defensible at 15%+ in three years is the operating record at the operators who paid the tuition first.
The supermajor playbook on operational AI is now ten to fifteen years deep. ExxonMobil's data and digital programs went into the Permian operating model in the mid-2010s and produced the 1,300-well neural-network ESP deployment that the SPE Artificial Lift Conference peer-reviewed in 2024. ConocoPhillips's IOCaaS architecture and its Plunger Lift Optimization Tool both ran on roughly the same arc. Chevron's closed-loop lift work on the Kaybob Duvernay was reported in JPT in 2024 on a 5% LOE reduction in year one. Shell's digital transformation program was disclosed in stages over the same window. Each of those programs is the visible end of a multi-year capital and headcount commitment.
The size of the commitment is the part that distinguishes the supermajor record from the Lower-48 record. The internal data layers, the integration backbones, the scoring engines, and the agentic execution loops the supermajors built in-house each took six to eight years and ran into hundreds of millions of dollars per program. The institutional learning paid for itself, but the absolute spend was supermajor-grade. There is no useful argument that a small-to-mid independent should build the same way.
The relevant question is not whether the supermajor playbook is real. It is. The relevant question is what changed between the supermajor build cycle and now that lets an independent capture the same operating leverage without absorbing the supermajor tuition bill.
The Lower-48 Winners Closed It in 24 Months
The most important data point in upstream operations between 2023 and 2026 is the Lower-48 deployment timeline. The operators that moved last actually moved fastest, because they bought a result instead of building infrastructure.
Devon Energy. ChatDVN. $260M annual run-rate. Devon disclosed on its Q4 2024 earnings call that ChatDVN, an internal AI program built on top of the operator's existing data estate, was at a $260M annual run-rate of identified savings. The build did not start with a multi-year data lake. It started with vertical scoring on the existing operating signal. The number landed on the call inside two years of the program's start.
ConocoPhillips. PLOT, IOCaaS. 80-90% maintenance reduction in selected activities, up to 30% gas production uplift on 4,500-plus wells. JPT's 2024 IOCaaS write-up documented the Norway business unit reductions, and the Plunger Lift Optimization Tool numbers are in the SPE "Unsung Hero: Artificial Lift" coverage. The reductions are activity-level: scheduled maintenance the model determined did not need to happen on the prior cadence, plus closed-loop gas-production optimization on wells the operator already owned.
APA Corporation. Palantir. ~$300M annually. APA disclosed the deployment scale and the order-of-magnitude impact in the public commentary that followed its Palantir Foundry rollout. The composition of the savings includes operations execution, supply chain decisions, and capital deployment, all running on the operator's existing data and the vertical workflows Palantir packaged on top of it.
ExxonMobil and SLB. DELFI. 2.2% uplift on 1,300-plus unconventional wells. The Oil & Gas Journal coverage of the SLB DELFI deployment with ExxonMobil documented the gas-lift optimization uplift on existing SCADA history. No sensor refresh. No new wells. The 2.2% number, applied across that fleet, is a peer-reviewed answer to the question of whether independent-scale operating data is enough to move the result.
Four named operators. Four independent peer-reviewed numbers. None of them required a multi-year platform project. All of them ran on the operating data the operators already had. The build window in every case was inside two years and in several cases inside one.
The mechanical reason the Lower-48 timeline compressed is that the vertical AI stack matured. The horizontal model layer is faster and cheaper. The integration tooling is mature. The peer-reviewed operating playbook is published. The four-week adoption pilot is documented. The supermajor record is the proof, and the Lower-48 record is the path.
The Bar Is Now the Floor
For most of the last decade, the supermajor playbook was an optional benchmark. An independent could miss the bar and the consequence was lower margins on a perfectly viable asset.
That is no longer the case in 2026.
The first reason is that the lenders and the buyers now treat operational efficiency above the bar as a default expectation rather than a competitive edge. The supermajors are operating against an internal cost of capital that is two-to-three points below an independent's. When the supermajor's operating cost per BOE is on the wrong side of the cycle, the supermajor absorbs the cycle. When the independent's operating cost is on the wrong side, the redetermination cycle does the absorbing.
The second reason is structural. The reserves and land position of an independent that runs 15% behind the bar are not less valuable to a buyer. They are more valuable, because the buyer can model the same 15% recovery into the acquisition case and price the deal accordingly. The independent's operating gap becomes the buyer's underwriting assumption. The asset transfers. The 15% becomes someone else's free cash flow.
The third reason is the institutional knowledge cliff. The lease operator with 18 years of basin knowledge is retiring. The replacement, if hired at all, is operating off a structured score by default. The operating model that the supermajors codified between 2015 and 2024 is now the only operating model the next generation of field staff will be trained to execute. An operator that has not put that model in place by the time the institutional knowledge walks out is rebuilding the operating discipline from scratch, on a higher cost structure, with a smaller labor pool.
The fourth reason is commercial. The supermajor playbook is migrating downstream into the top quartile of independents now. The first-mover advantage on FCF is real and measurable. The second-mover position is competing for the same crude on a higher cost structure. The third-mover position, for the operators still on a fixed route and a quarterly variance report, is the acquisition target.
The bar at 15%+ in three years is no longer the ambition. It is the floor.
The Independent Path: Adopt the Result in a Day, Move the Number in Four Weeks
The single most important difference between the supermajor build cycle and the independent path in 2026 is that the independent does not have to build anything. The operating model is published. The data integration runs read-only. The scoring layer is configured against the operator's existing SCADA, historian, production accounting, and EAM. The crew workflow does not change shape. The route changes order.
The shape of the path is in The Four-Week Pump-by-Priority Pilot. The compressed version is four weeks, one signed metric, and a walk-away clause in writing.
Week 0. Sign the metric, not the software. The operations leader, the asset manager, and the controller pick one metric. The most common Week-0 metrics for an FCF pilot are mean time from anomaly to first field response, deferred production recovered per crew shift in BOE, and emergency-versus-scheduled workover ratio. The threshold for "moved" is on a one-page document the controller signs. The Impact Guarantee makes the pilot the experiment, not the procurement.
Week 1. Read-only integration on the stack you already own. SCADA or historian, production accounting, EAM or CMMS, GIS, and the pumper's existing field data capture. Read-only. Five to seven working days. No new sensors. No rip-and-replace. The systems that are authoritative today remain authoritative tomorrow.
Weeks 2 and 3. The score runs live. The ranked plan hits the truck cab. The scoring loop runs nightly against the operator's full asset base. Every well, every artificial lift unit, every open work order is scored on probability of intervention-worthy event in the next seven days and free cash flow at risk on the asset. The ranked plan is published to the field tablet and the operations center by 6 AM. The superintendent adjudicates the top 20 items each morning. The field observations flow back into the score before the next ranking runs. The discipline of exception-based surveillance, documented in Exception-Based Surveillance, is now in effect on the pilot route.
Week 4. Measure, decide, sign. The chosen metric is measured against the Week-0 baseline. If it moved past the threshold, the operator signs the annual on the same Impact Guarantee terms and the pilot route expands to the full asset on a 60-to-90-day rollout. If it did not, the operator walks away with the integration documentation and the baseline data. No license fee. No kill fee.
The deployed reference at the top 25 private producer followed this exact shape and delivered 15%+ FCF uplift on a 5,000+ well portfolio inside six months. The pilot is the experiment. The supermajor record is the proof. The math on the operator's own assets is the answer.
Why the Bar Will Keep Moving Up
The 15% bar at three years is the 2026 number. The trajectory points to a higher number on a shorter horizon.
The inference cost reduction documented in the Stanford 2025 AI Index, roughly 280x on a GPT-3.5-class call versus the launch price, has not finished compounding. The vertical AI stack continues to mature. The peer-reviewed operating playbook will accumulate more case studies, more basins, and more operator types over the next 24 months. The compliance window on EPA OOOOb forces continuous monitoring across most onshore tank fleets through 2026 and 2027, which produces a step-change in available signal at every operator that absorbs the rule rather than just paying for it.
The bar at 20%+ in two years is the visible 2028 number. The operators clearing 15% this year are running ahead of that next bar. The operators waiting for the perfect data lake or the perfect SCADA refresh are running behind two bars at once.
The bar moved because the operators who set it are still moving. The independents that adopt this year close the gap to the supermajors and outperform their cost of capital. The independents that wait, widen the gap and pay the cost twice.
FAQ
What is the 3-year, 15% operating bar in oil and gas?
It is a description of the operational efficiency floor that has been demonstrated, on the public operating record, at the supermajors and the top quartile of Lower-48 independents over the last three years. Fifteen percent or more of operational cash flow improvement, against the asset base the operator already runs, achievable through deferment recovery, route optimization, exception-based surveillance, and closed-loop lift control. The bar is anchored on named, peer-reviewed deployments and on the top-25 private producer reference deployment of 15%+ FCF uplift inside six months on 5,000+ wells.
Who has actually cleared the bar publicly?
ExxonMobil (and SLB DELFI) on 1,300+ unconventional wells at 2.2% uplift, peer-reviewed at SPE Artificial Lift 2024. ConocoPhillips on the Plunger Lift Optimization Tool across 4,500+ wells at up to 30% gas production uplift, and IOCaaS at the Norway business unit at 80-90% reduction in selected maintenance activities, both published in JPT 2024. Chevron on the Kaybob Duvernay closed-loop lift control at 5% LOE reduction in year one, JPT 2024. Devon Energy on the ChatDVN program at a $260M annual run-rate disclosed on its Q4 2024 earnings call. APA Corporation on the Palantir Foundry deployment at approximately $300M annually. None of these required a multi-year data lake. All ran on the operating signal the operator already had.
How did the Lower-48 winners move so fast?
They bought a result rather than building infrastructure. The supermajor build cycle ran six to eight years because the operators were inventing the operating model. By 2023, the model was published, the inference cost had dropped roughly 280x, the vertical AI stack was mature, and the integration tooling was production-grade. The Lower-48 winners adopted the result into existing operating workflows on a two-year window, and in several cases inside one.
What does the math look like on my operation?
For a 500-well operator at $70 realized, an average of 30 BOPD per well, and a 2% deferment recovery, the first-lever number is roughly $7.66 million in annual cash flow. The 15% bar is the aggregate of that lever plus route, maintenance, hauling, and engineering allocation. A 500-well operator running 5% behind is leaving $2.5M+ on the table annually. A 500-well operator running 15% behind is leaving $7.66M. Run the same calculation on your own well count, basin BOPD, and realization to size the gap on your asset.
Does this work on a 200-well independent?
Yes. The constraint at small scale is not the data quantity. The operating signal in a 200-well portfolio with a single SCADA, a production accounting feed, and an EAM tool is enough for the vertical AI to produce ranked field decisions. The constraint is the maturity of the field workflow that consumes the decisions. The four-week pilot addresses both at the same time.
Why is this bar the floor and not just an ambition?
Because the buyers and lenders now treat the 15% efficiency band as a default expectation rather than a competitive edge. The reserves of an operator running 15% behind the bar are more valuable to a buyer, not less, because the buyer underwrites the recovery into the acquisition case. The operating gap becomes the underwriting assumption at the deal table. The asset transfers. The 15% becomes someone else's free cash flow.
Is the supermajor playbook actually transferable to an independent?
The operating framework is. The build sequence is not. The supermajors invented the operating model in-house over six to eight years and several hundred million dollars apiece. The independent does not have to do any of that. The framework is documented in peer-reviewed case studies, the inference cost is two orders of magnitude lower than during the supermajor build, the integration runs read-only on the operator's existing stack, and the pilot is four weeks. The operating leverage is the same. The cost structure is not.
What is the WorkSync Impact Guarantee?
Four-week pilot. Read-only integration on the existing SCADA, historian, production accounting, EAM, and GIS stack. The operations leader and controller pick one metric in Week 0 and sign the threshold on a one-page document. If the metric moves past the threshold by Week 4, the operator signs the annual subscription. If it does not, the operator walks away with the integration documentation and the baseline data. No license fee. No kill fee. The clause is in writing.
What is the relationship between this article and the 15% Cash Flow article?
The 15% Cash Flow article maps where the 15% leaks: deferred production, reactive maintenance, route inefficiency, hauling, and engineering allocation. This article maps when the bar was set and who set it. The two articles are the structural and chronological views of the same operating fact.
Start the 4-week pilot. Four-week WellOPS pilot on the data stack you already own. One signed metric. Walk-away clause in writing. The bar is the floor. The pilot is the path.